If you cross Justify with Warm Heart you stand a great chance of having a horse who can win races. But, it’s not a guarantee. Just ask whoever bought Snaafi Dancer for 10m only for it to never win a race.
You could send a horse to Willie Mullins – that seems to be the current ticket to the winning enclosure!
The TPD data science team are taking a far more prosaic approach to this question and assessing whether predicting average speed offers up more winners than just backing the favourite.
Average Speed
This is a relatively novel approach since the thrill of discussing winners tends to revolve around the assessment of more glamorous things like acceleration, late speed, the ability to quicken (more than once) and other anathema concepts to outsiders. Adding sensors to every horse opens up the data that the eye cannot see and the chance to measure average speed based on biomechanics rather than finishing times.
A quick digression for Jumps fans
It’s vaguely recognised that jumping fluently is enormously important but rarely quantified. Our friends at RaceIQ are now measuring lengths gained jumping while we already measure the average speed loss through the obstacles.
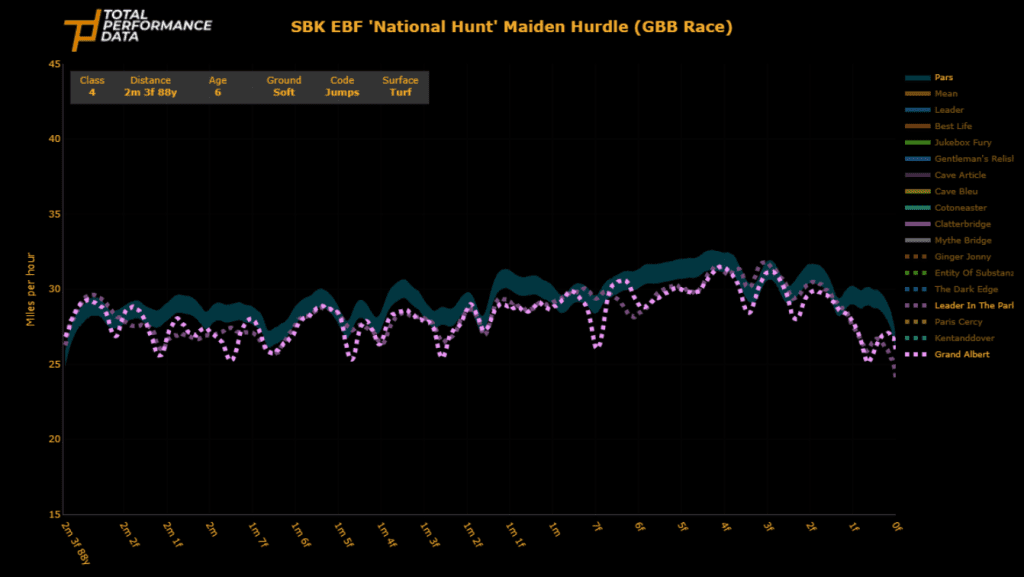
Luckily for Lady Dulverton and Ben Pauling, this costly gelding (Leader in the Park), flew through the hurdles at Doncaster on the 21 February 2024 as the above chart shows to win by 12 meters. His average lowest speed through the hurdles was 12.1mph versus 11.5mph for the horse he beat (Grand Albert). Across 10 obstacles – this is a huge advantage!
How do thoroughbred’s race?
If we go back to basics. Once horses break from the stalls/gates and hit 30mph/45kph they are at racing speed aka galloping. Their average speed during this moment of highest effort (prior to easing off if winning or losing by a margin at the end) is the key to winning the race. If this sounds obvious, consider the length of limbs and angle of muscles, when standing, can soon predict the future average speed of the horse before they have even seen John Gosden’s baseball cap on the gallops in Newmarket.
A smooth average speed
For flat racing, running efficiently helps average horses win races. Elite horses can win races by running inefficiently. One way to measure running efficiently is the deviation from your average speed. Clive Cox trained Cracking Gold won a class 4 for 3 year olds despite deviating the most from his average speed. That might be because his top speed was so much higher than the others thereby proving this isn’t a great metric! But, it shows Cracking Gold has great potential.
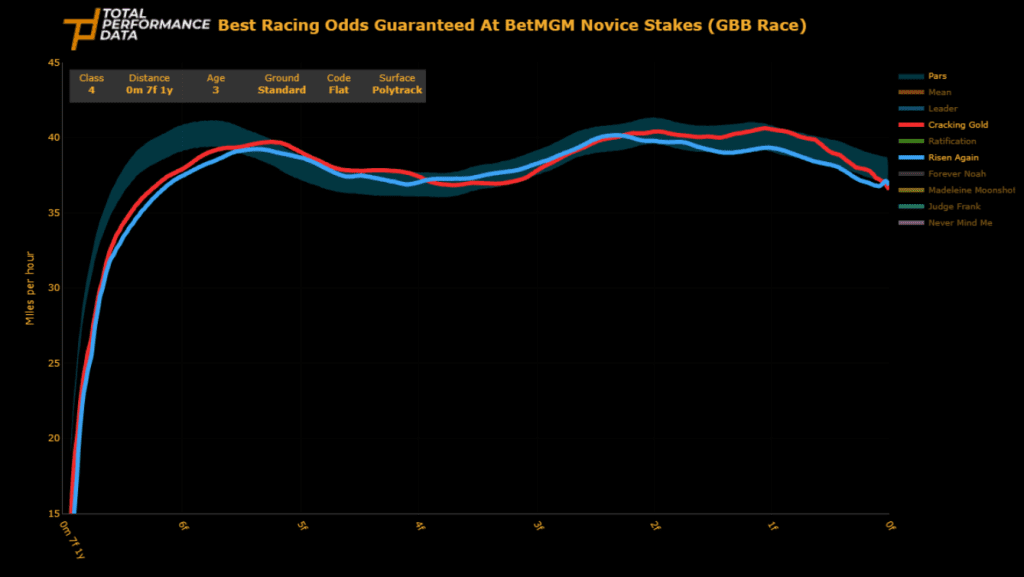
So, back to predicting average speed to predict winners. Clearly the devil is in the detail of what defines average speed. But, crudely, having the highest average speed means you win the race! It’s possible to predict average speed since length of stride multiplied by number of strides gets you to expected average velocity. Cracking Gold’s average speed in this race was 39mph versus 38.6mph for the horse in second (Risen Again).
Distance, going (soft v good etc) and camber will have (adjustable) effects on past stride data. A lack of fitness might have an effect too.
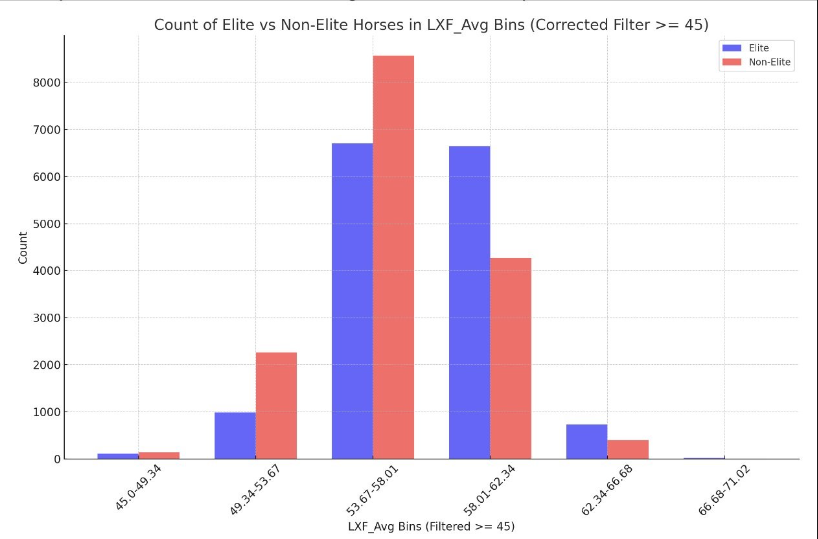
Our allies at Performance Genetics have multiplied average stride length x by stride frequency (strides per second) and separated the results between elite (over 90 rated) and non elite (max rating of 60) to show that better horses have a higher average speed. While that may sound obvious, the ability to predict and rank horses by this metric pre race surely opens up profitable betting strategies and yearling sales insights.
For more information or a subscription to TPD’s derived speed metrics please contact adam.moore@totalperformancedata.com or go to www.TPD.Zone