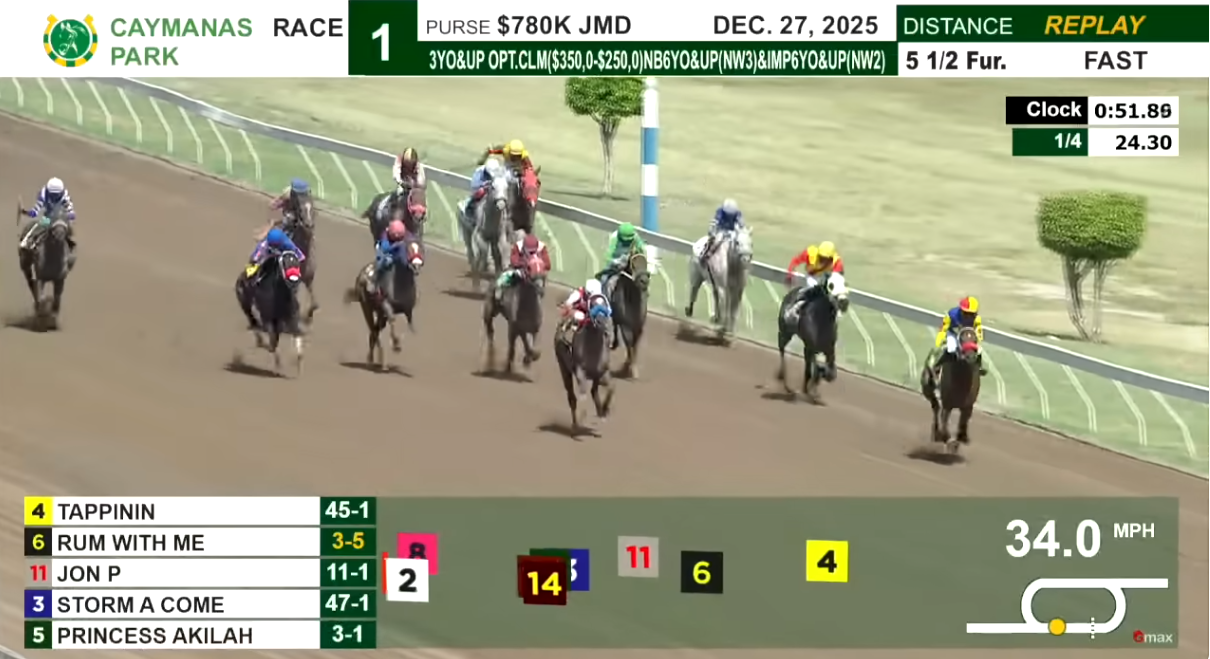
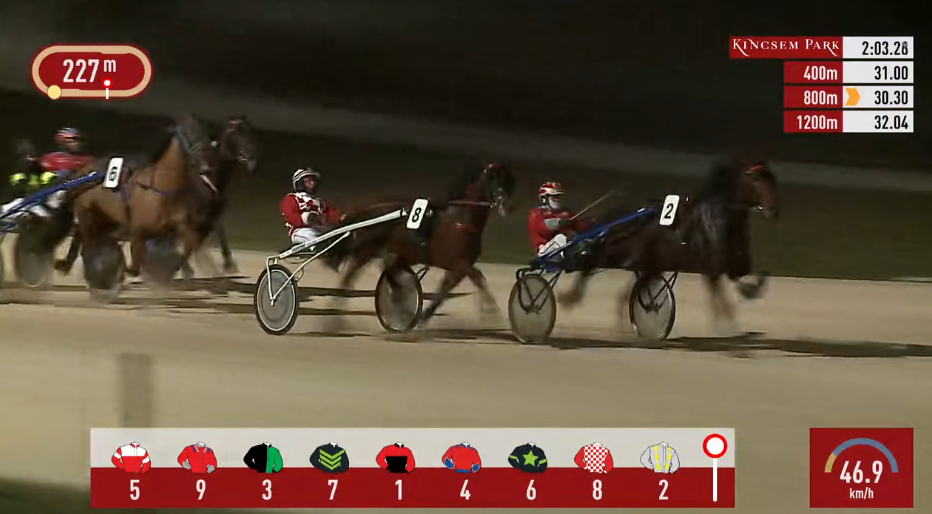
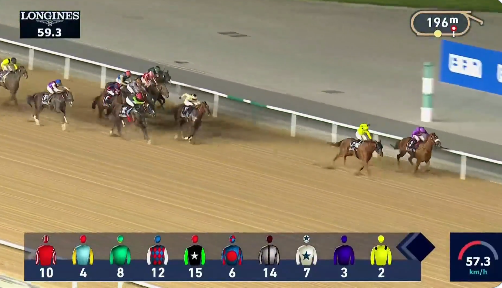
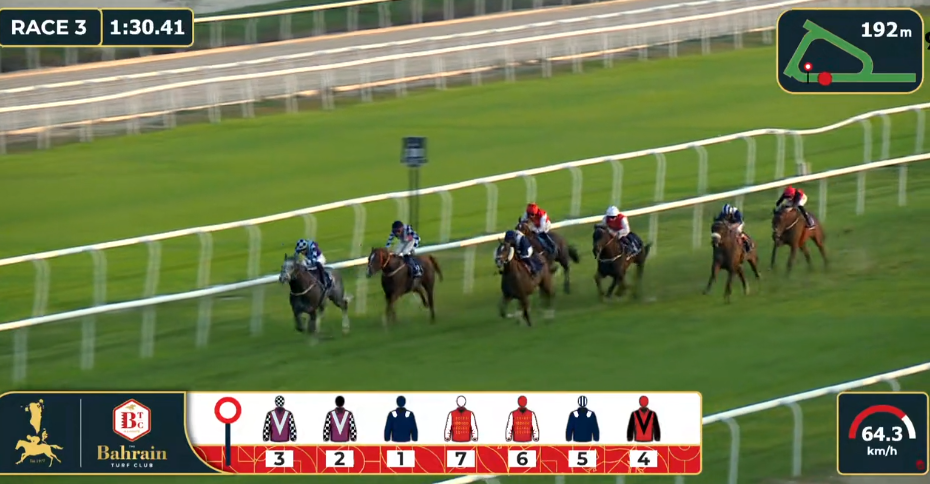
TPD’s graphics illuminate what is actually happening in the race. Racegoers no longer have to wonder if the pace is too fast or too slow, or peek through their binoculars to decipher which position their horse is in.
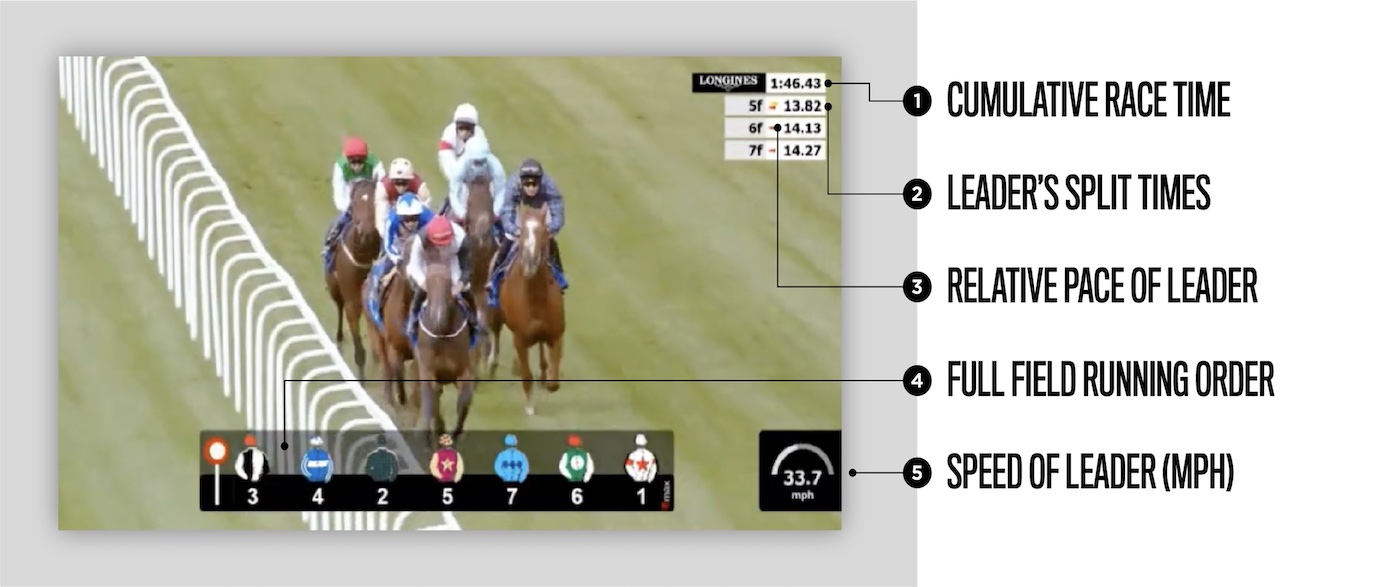
With TPD graphics at your racetrack and broadcast, you can show how the race is unfolding. Leader pace, field order and sectional times can be displayed on screens and mobile devices.
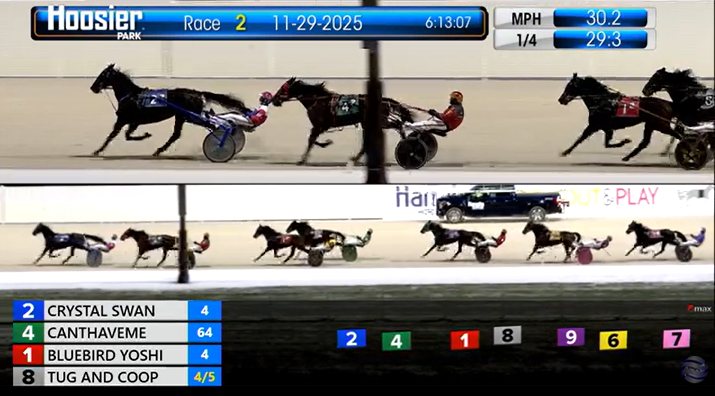
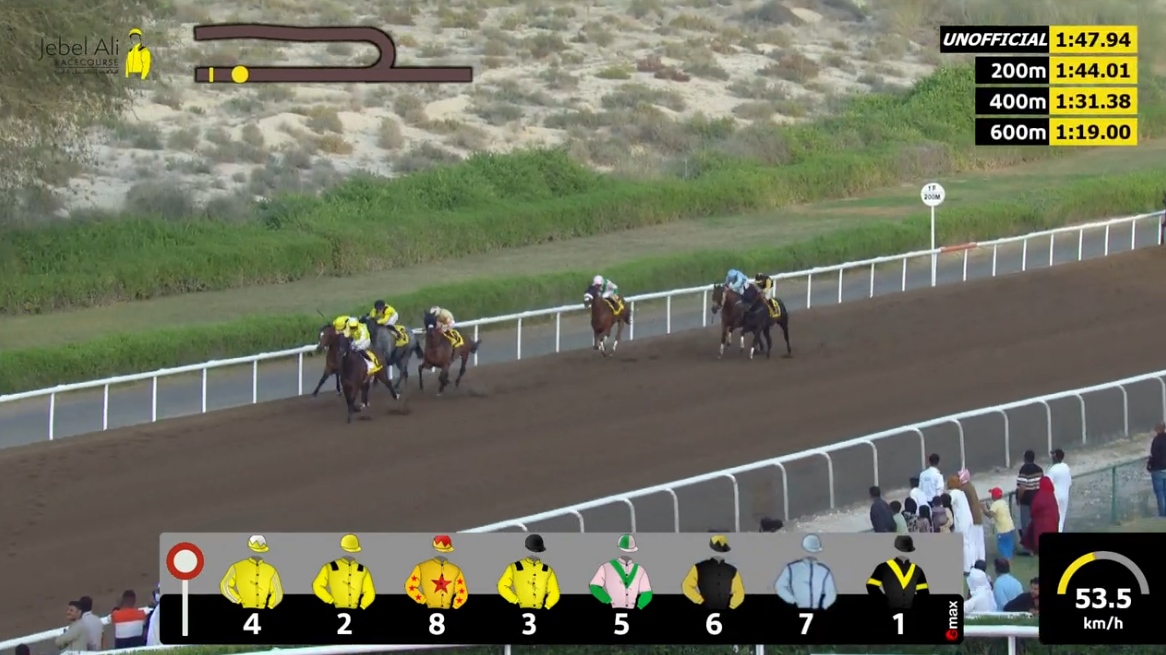
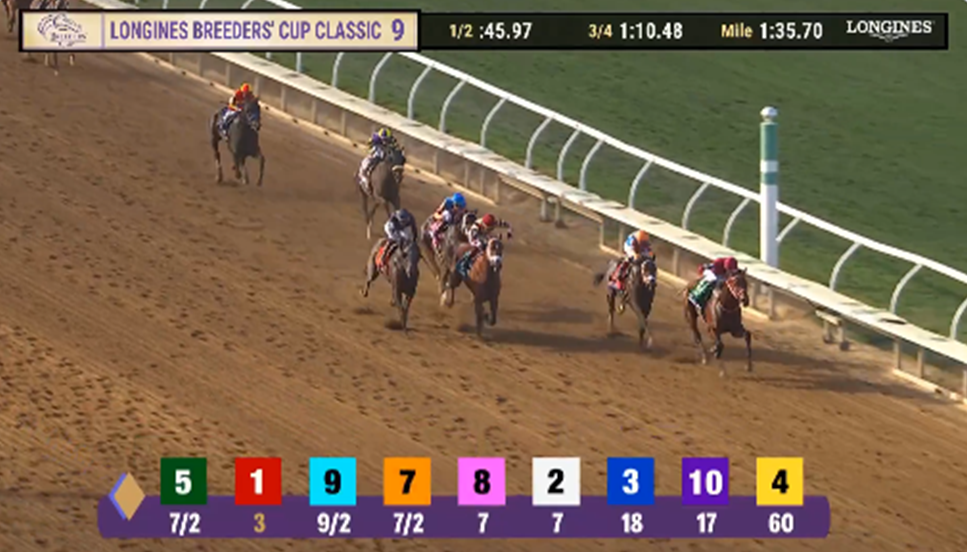
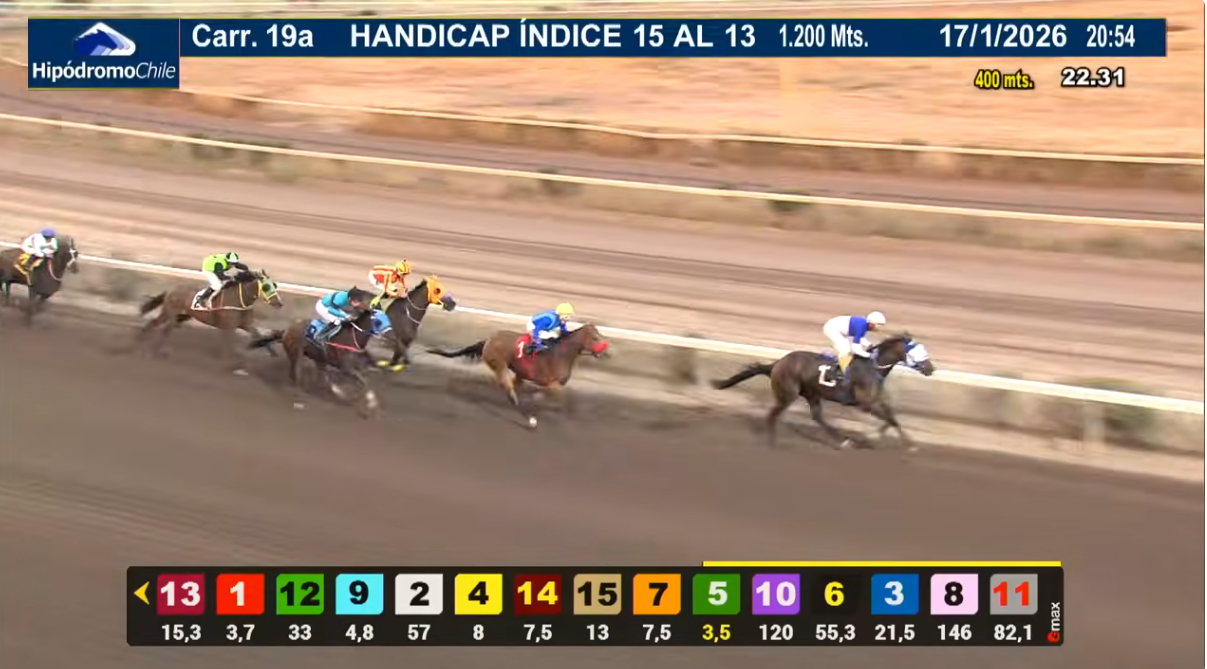
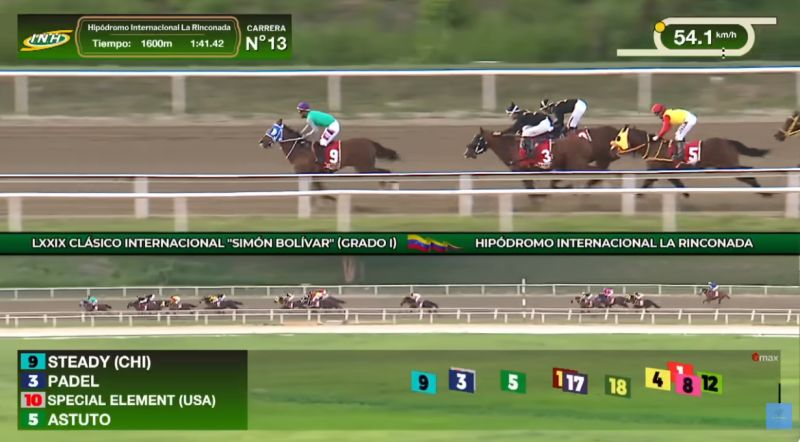
Overlayed on top of the broadcast of the race, these graphics include the running order for the race, speed of the leader, split times and more. If you’re interested in our GPS tracking and graphics system for you racetrack, please get in touch.
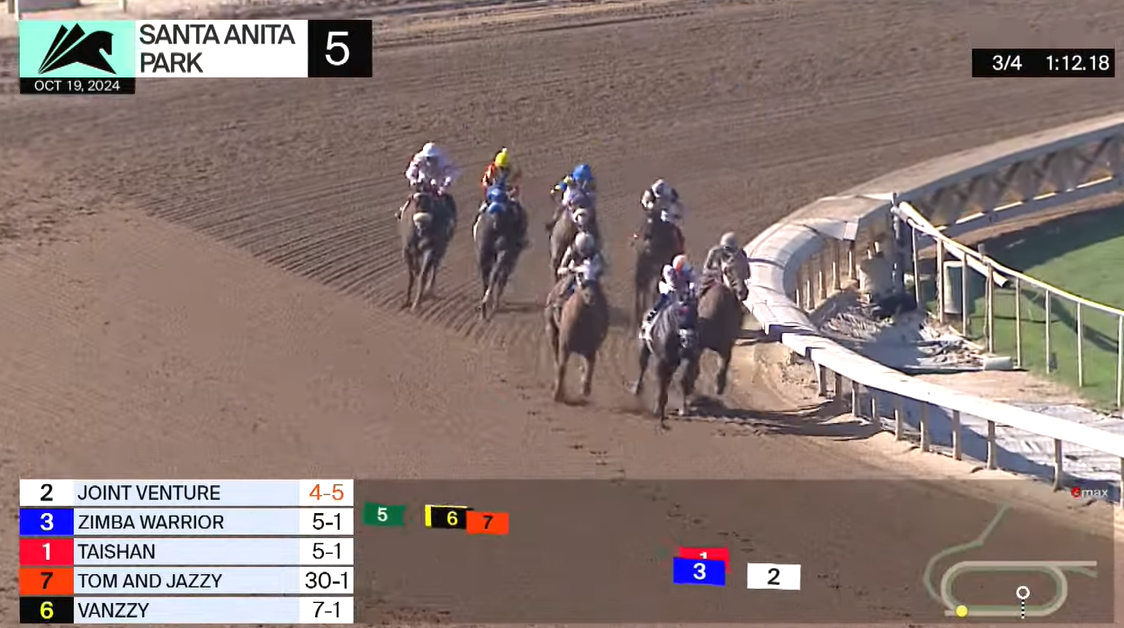
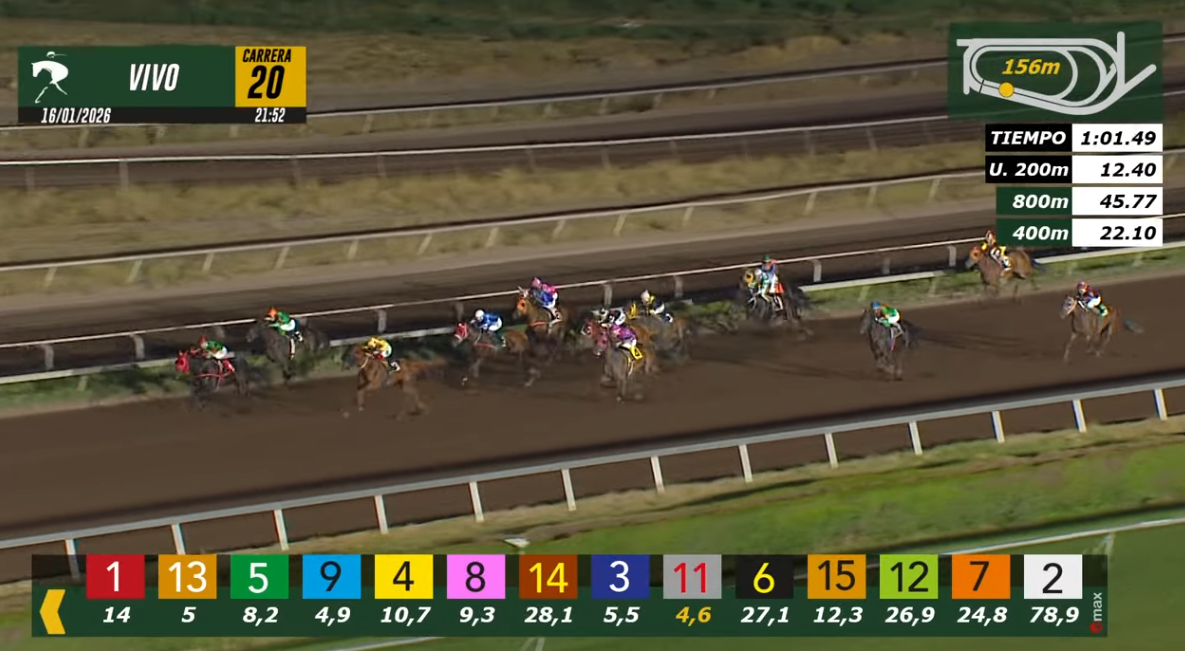
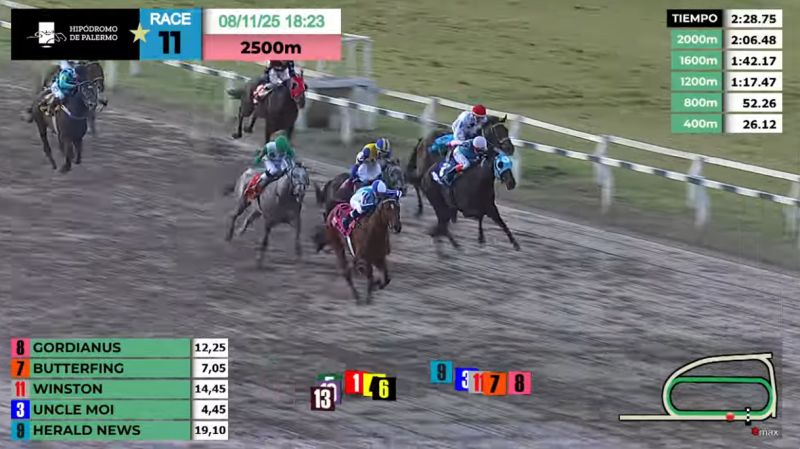
Developed by our exclusive technology partners, GMAX Technologies Ltd, our agile tracking and graphics solution powers in-race graphical insights for TV and online audiences around the world. Overlayed on the live broadcast the graphics feature running order, speed of the leader, split times, live odds or win percentages, Exacta dividends and more. Our broadcast partners include Sky Sports Racing, FanDuel TV and Wettstar TV…
Sky Sports Racing: Lingfield (Flat)
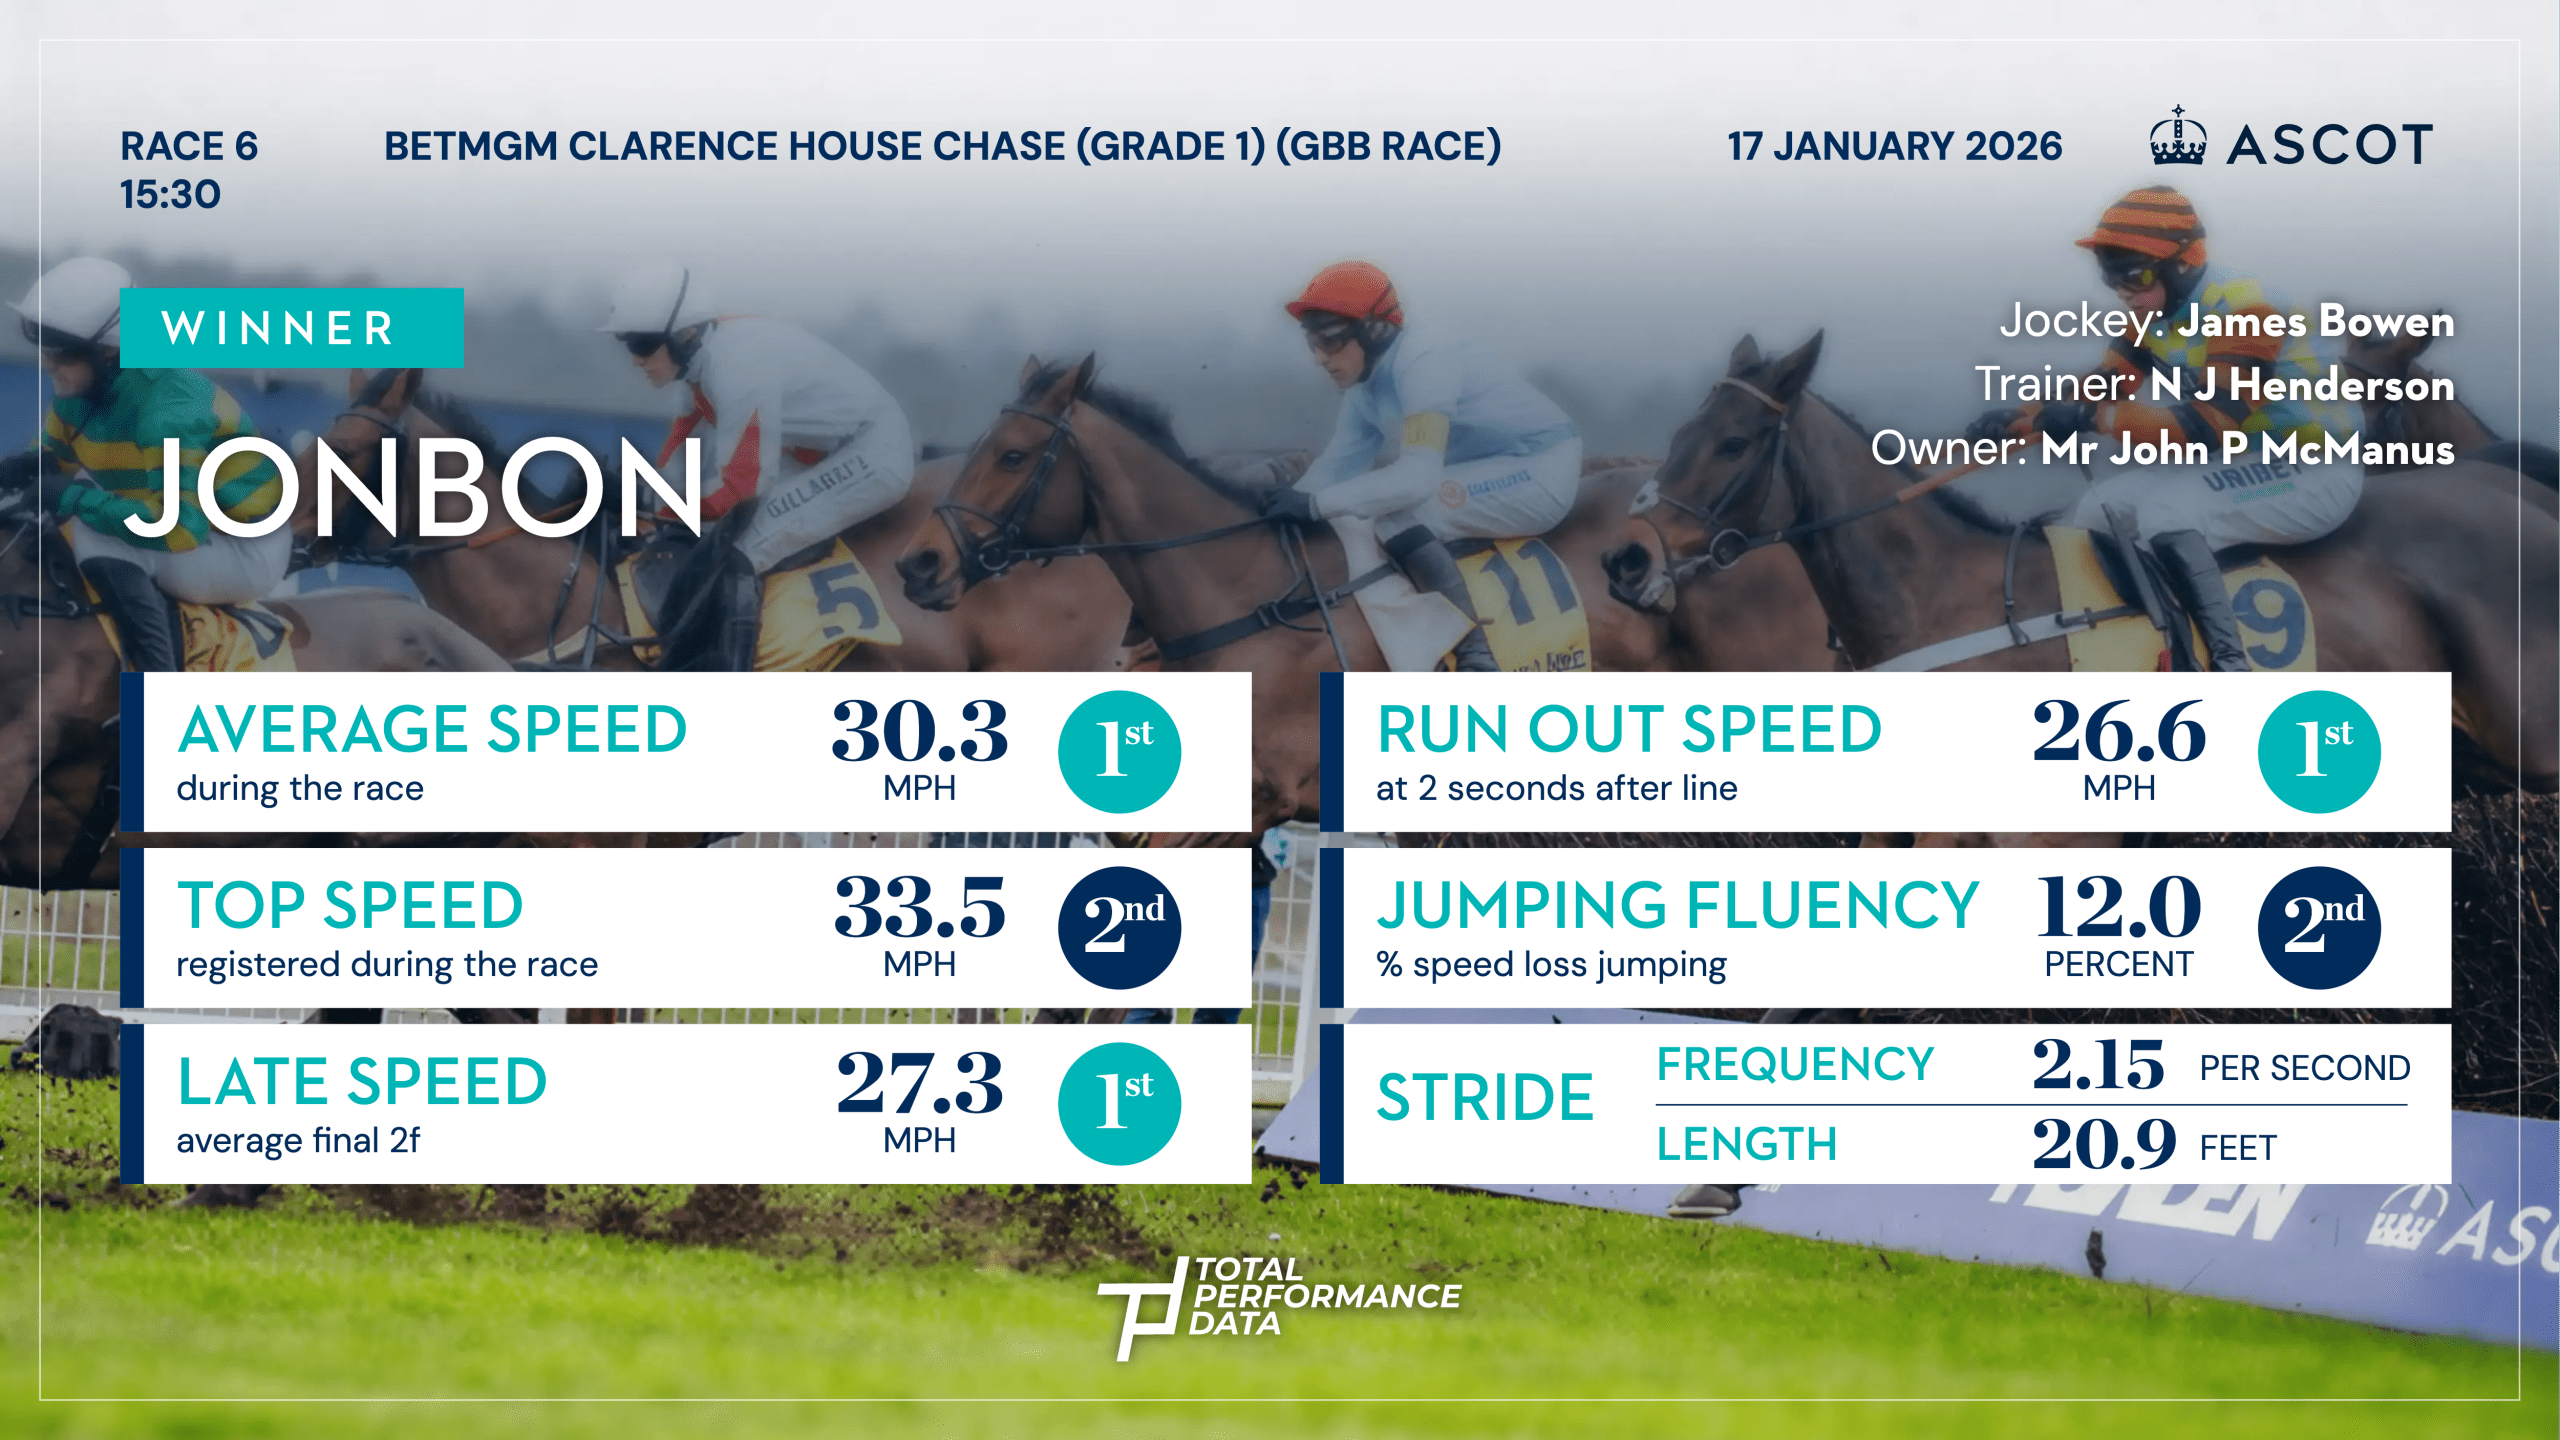
Sky Sports Racing: Ascot (Jumps)
FanDuel TV: Santa Anita Park
FanDuel TV: Tampa Bay Downs
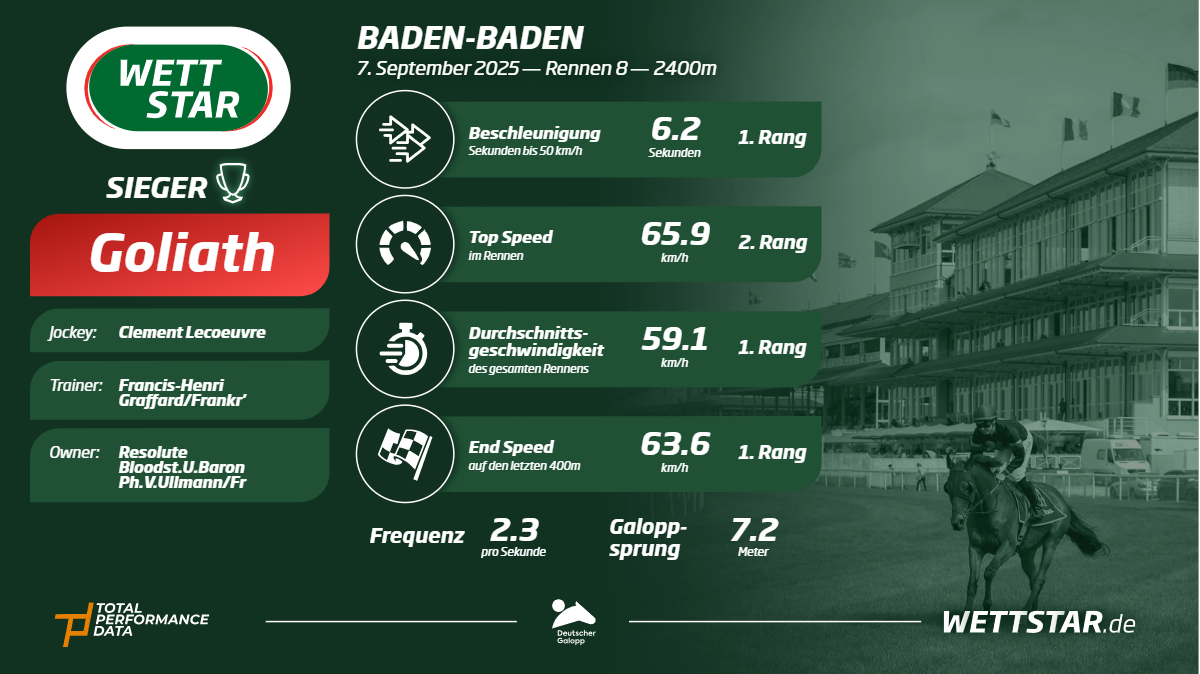
Wettstar TV: Baden Baden